Data were obtained from monthly webpages at the National Weather Service's Southern Regional Homepage. Data were entered into excel and plotted. Rainfall data were massaged by averaging over 11 month running periods. Temperature data were averaged over the 84-year period for each month and the given month's temperatures were subtracted from that average to produce an index of deviation from the average marked as zero.
Summary
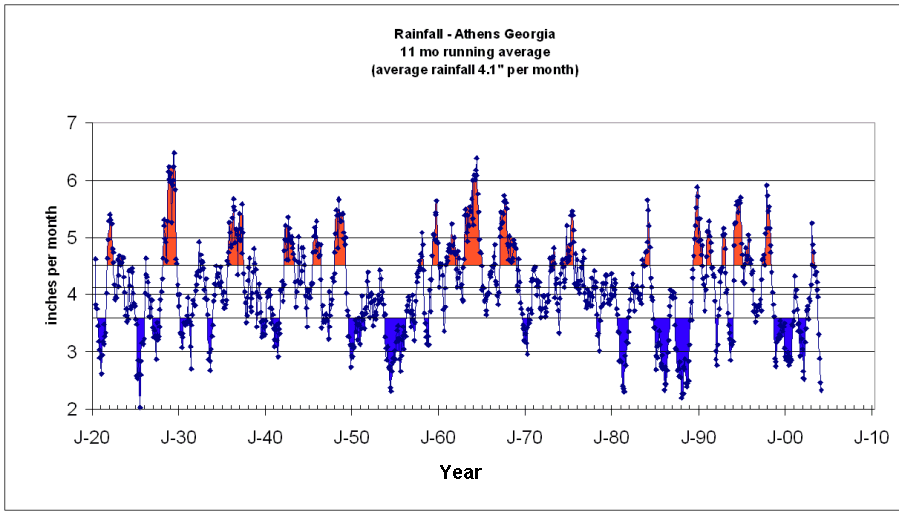
Athens typically gets about 4" rainfall per month, and it is fairly evenly distributed throughout the year - a little drier in the fall. Rainfall is more variable than temperature. Athens has experienced three major long-term droughts in the last 85 years: in the 50's, in the 80's and from 1998-2002. An additional three or four lesser droughts have occurred. It has also enjoyed sustained periods of above-normal rainfall:1942-1949, the 60's and 70's, and 1990-1998.
Summer temperatures generally range within the standard deviation, except for a period of very hot weather in the 1930's, early 50's, mid 80's and 1994.
Rainfall
A threshold of 0.4" above and below the average was selected, somewhat arbitrarily. A deviation beyond this threshold that was sustained for over 5 months was considered either a drought (blue: below the line) or a rain surplus (red: above the line).
Analysis
The 1950's were a decade of drought, with no periods of normal or above-normal rainfall. Especially intense were the droughts of 1950-1952 and 1954-1958.
Similarly the 1960's were a decade of rainfall surplus, a trend that actually continued throughout the 1970's with the exception of two short periods of drought (1970-1971 and a few months during 1978).
The 1980's began with a short drought in 1981, followed by normal rainfall and a surplus in 1984. A five-year drought (1985-1990) ended the 80's.
Most of the 90's (1990-1999) were periods of rain surplus, punctuated in 1992 and 1994 by two short droughts, but a nearly four-year drought began in 1999, ending in 2003. A period of excess rain occurred in the summer of 2003, and followed by a drought lasting well into 2004.
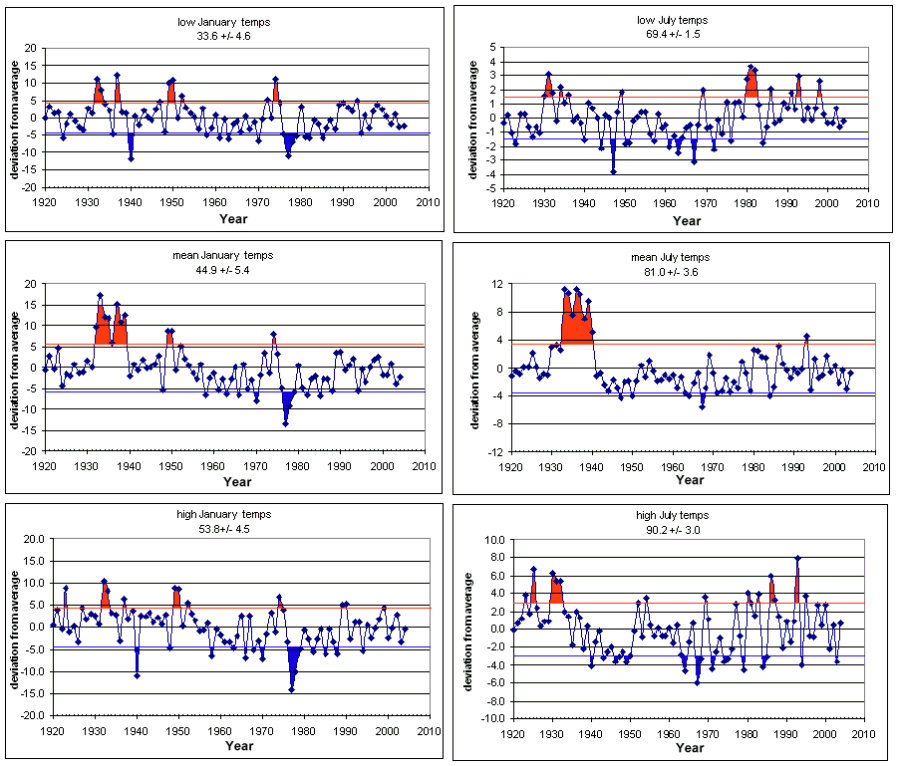
Temperatures
The threshold selected was the standard deviation above and below the average (0). Higher than normal temperatures are in red; lower than normal temps are in blue.
January is usually our coldest month and July our warmest. Plots are given for the average highs, lows, and means for each month.
Analysis
Dominating the above-normal variation in temperatures through the last 84 years are periods of extra warmth extending throughout the 1930's in both summer and winter. Summer temperatures were especially high in the mid-twenties and early 30's. Such sustained warmer than average weather has not occurred since, except shorter periods of higher than normal summer highs in 1954 and 1955, and again in 1987,1988, and 1994. Higher than normal winter highs and lows occurred in 1974 and to some extent in 1972.
Average to above average high January temps were only broken twice in the 85-year period;once in 1940, and again in 1976-1979 when lower than average high January temperatures occurred. Lower than average low January temps occurred during these times, and also periodically throughout the later 50's and 60's: 1958, 1959, 1961, 1963, 1966, 1970. In addition 1982-86 exhibited fairly low average low temps in January.
With the exception of the highs mentioned above, July average temperatures have been fairly uniform for the last 85 years. No real deviations of cooler than average temperatures are observed except possibly 1965 and 1968.
There is some spotty correspondence between temperatures and rainfall. The droughts of the 30's were accompanied by periods of extra warmth, but those of the 50's were not, nor was the drought of 1998-2002.
The sustained rain surpluses of the 60's, 70's, and most of the 90's were generally accompanied by lower than usual mean temperatures. The droughts of the 80's were accompanied by high July temperatures in 1980, 81, and 86, but low July temperatures in 1984 and 85. Oddly the mean January temperatures were quite low in 1981, 82, 85, and 88, during periods of drought.
Interestingly the last ten years, although mostly drought conditions, has not seen especially higher mean temperatures in January or July.
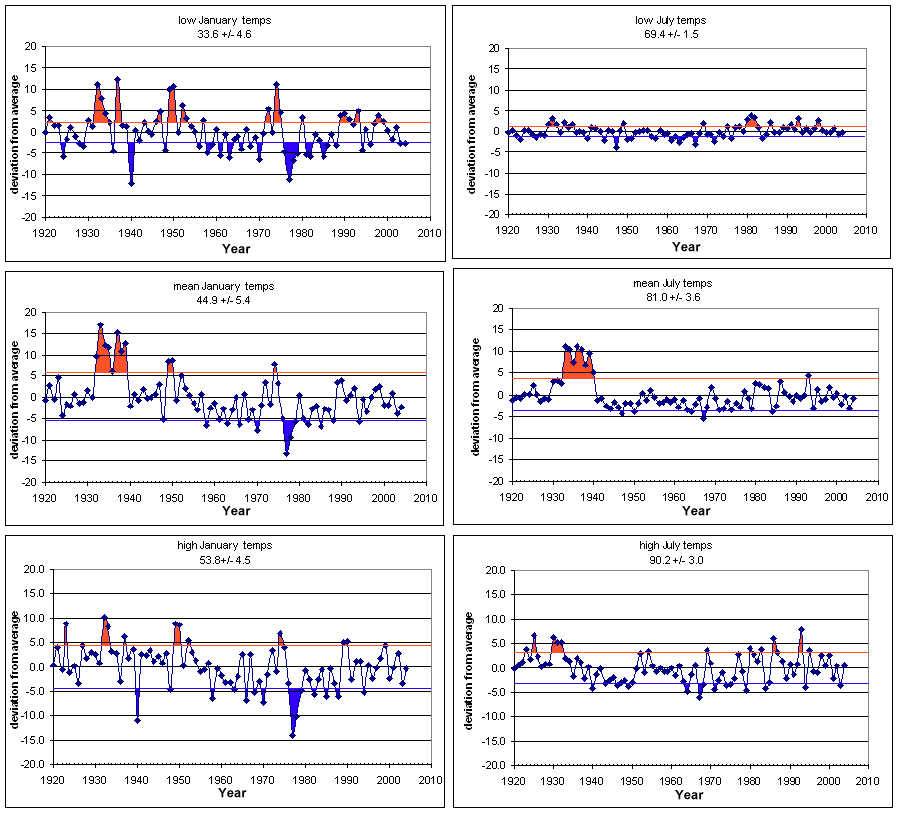
The above temperature summary figures were scaled to give the same range of deviations in all six panels. I've redrawn the panels below to scale the ranges more in line with the actual deviations for those panels.